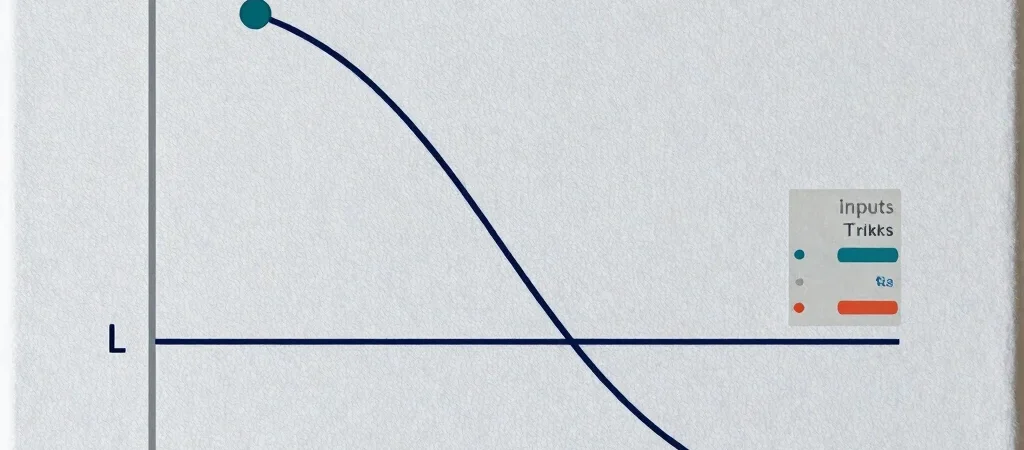
A payoff chart can look reassuring or alarming before you know what it is plotting. On OptCurve, the curve shows the modeled profit or loss at expiration based on the strategy type, strikes, premiums, and contract count you enter. Change an input and the picture changes with it.
Start With the Inputs
Check each leg of the position before reading the line: strategy type, strike, whether the option is bought or sold, and premium. Then confirm the number of contracts and any target price you want to inspect. A misplaced strike or premium can shift the breakeven price and make the whole curve misleading.
Trace Price Across the Chart
The horizontal axis represents the underlying asset’s price at expiration, while the vertical axis shows the modeled P&L. Follow the curve to a target price to see the result under those inputs; where it crosses zero is a breakeven price in the model. A breakeven is not a prediction about where the market will trade.
Read the Edges Carefully
The far ends of the chart help show best- and worst-case scenarios within the prices displayed and the strategy’s expiration payoff structure. They do not account for every real-world outcome or guarantee that a position can be closed at a particular value. Before drawing a conclusion, check the assumptions and remember that an expiration chart does not show how the position’s value may change beforehand.